Overview
This application is used to view the schedule trends for measurable feedback data.
Function
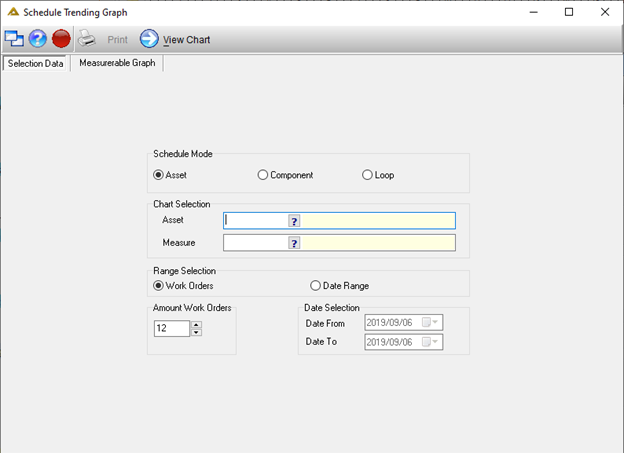
When the application is opened, you will view the following screen:

Select a Schedule mode to either show Asset, Component or Loop schedules. Select the asset/component/loop and what you would like to measure.
You can either measure per work orders or a date range. The amount of work orders will be 12 by default but can go up to 25. Once you have completed the selection criteria, click on the ![]() button.
button.
Schedule feedback data can be captured for work orders with measurable tasks. This measurable data can be used to graphically show when services were done and when they should happen again.
The Schedule Maintenance application is used to set up the measurable tasks. These tasks will be set up to have a maximum and minimum range. The desirable outcome for the captured measurements is to always remain within the predefined range.
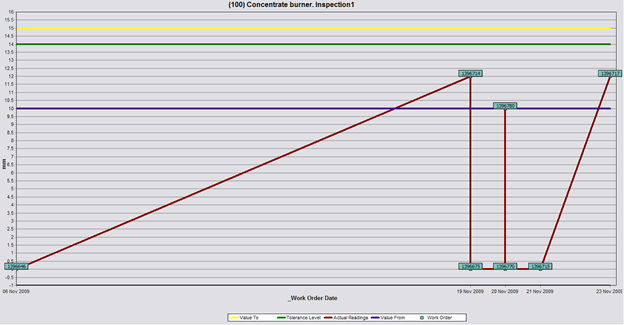
Example Chart:

![]()
The value from and to lines represent the maximum and minimum range where the measurements should fall within. Measurements outside of this range are considered to be problematic and should be looked at.
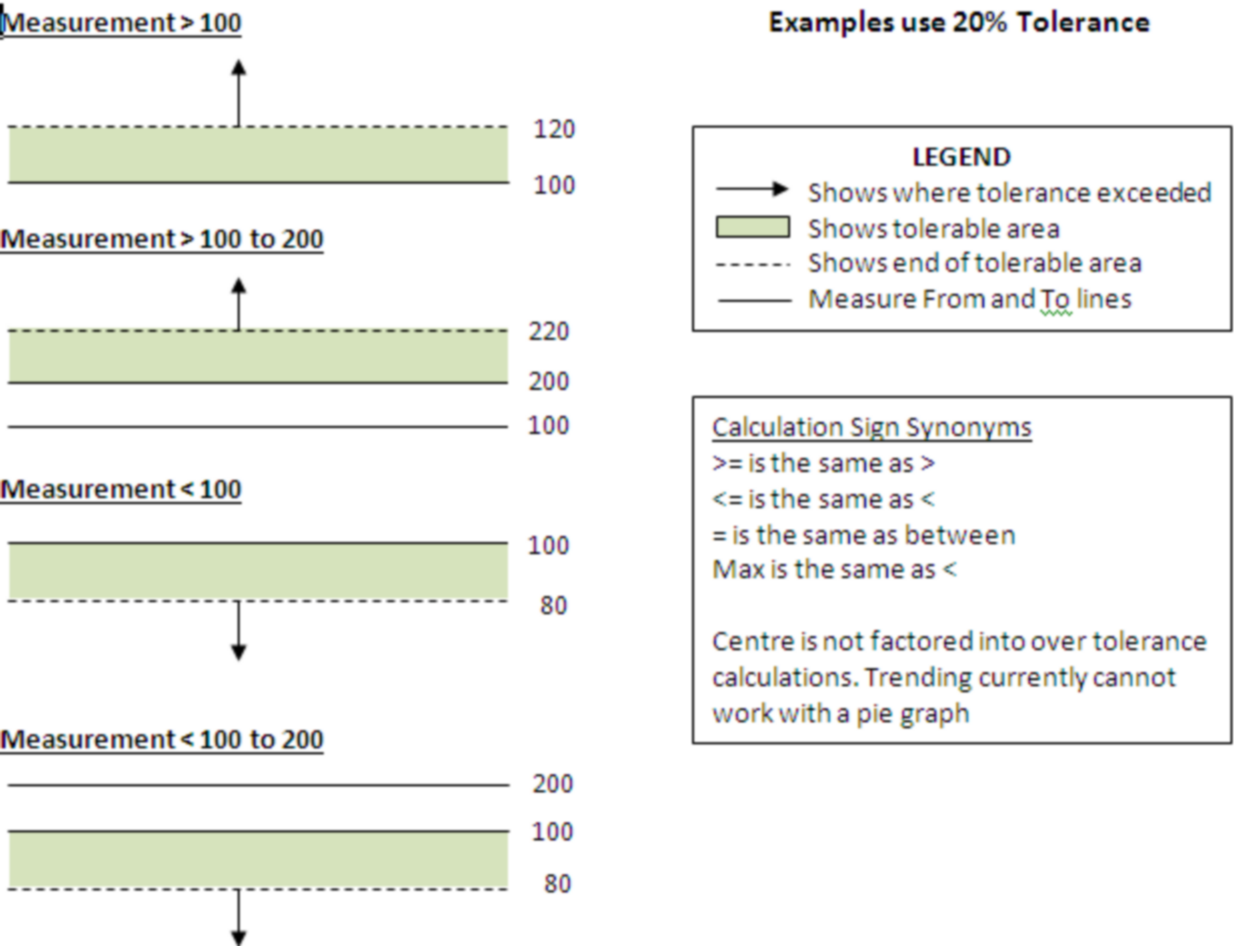
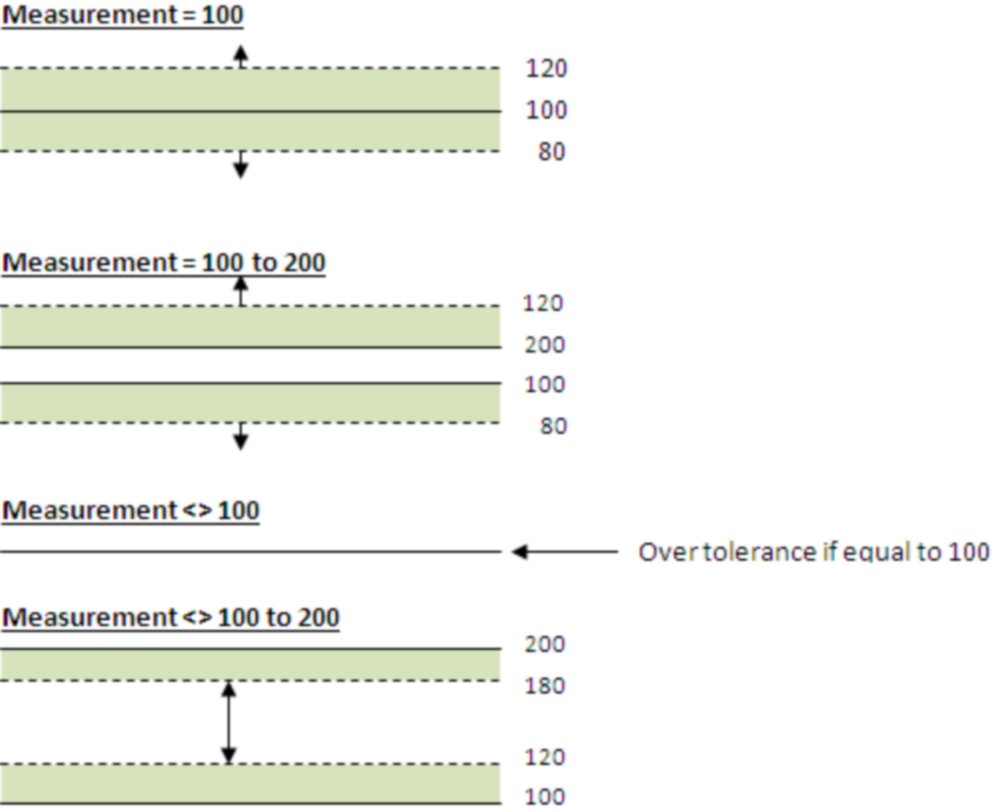
The range between the tolerance level line and the value to line represents the tolerance area. Measurements within this area should be looked at for preventive maintenance to avoid problems within the near future.
The actual readings line shows the measurements captured while feedback was captured for the work orders.
The bottom axis of the chart shows the required date of the work order. The actual readings line in combination with the required date provides a time line to show how measurements have changed.
The ![]() button will print the chart directly to your default printer.
button will print the chart directly to your default printer.

