Overview
This application is designed to allow a system administrator to view SQL Server process information. It displays vital information to the administrator about the system activities and allows the analysis of process information to establish the level of system performance. It allows the identification of any processes causing performance problems like uncontrolled blocking of database tables.
Function
Monitor Options
These options allow the system administrator to view different groups of processes to enable the distinction between SQL system processes used by the database engine or user invoked processes that is created when applications are opened.
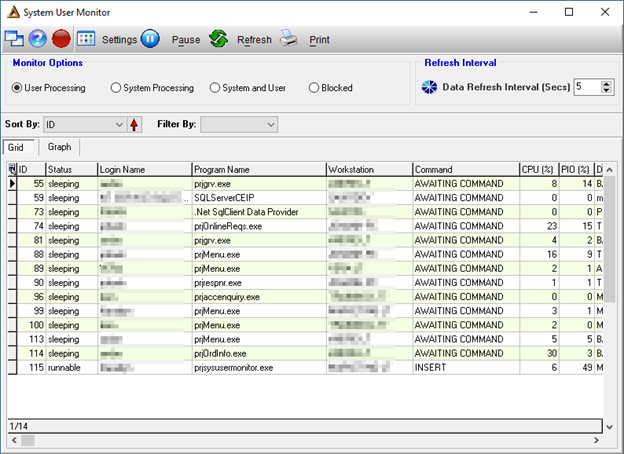
User Processing
This option includes all processes of users logged onto the SQL Server database. By default, this radio button will be selected when you open the application.
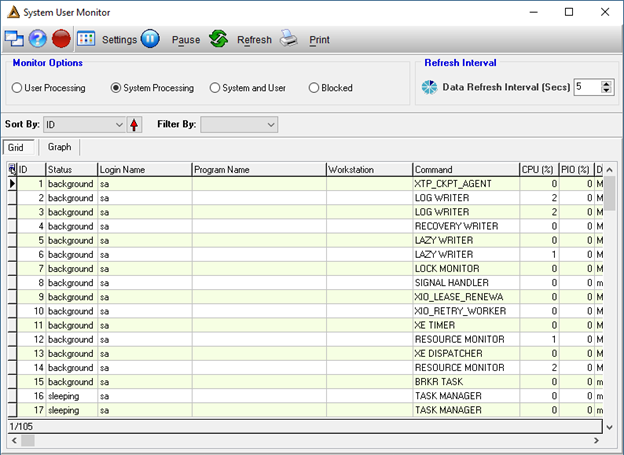
System Processing
This includes all the SQL server system related processes responsible for running and maintenance of the SQL server database engine. This includes for example scheduled SQL jobs.
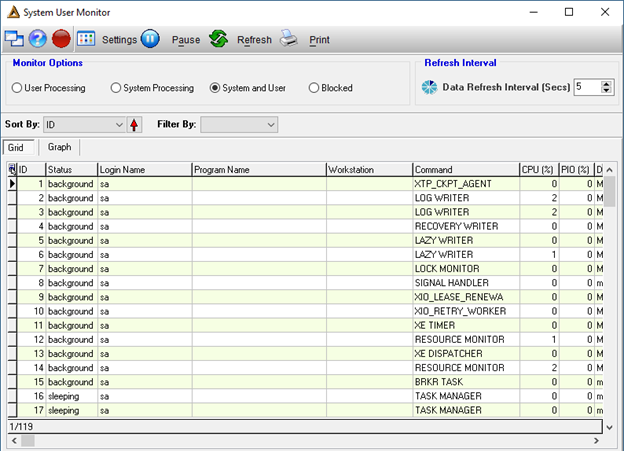
System and User
Returns all active processes.
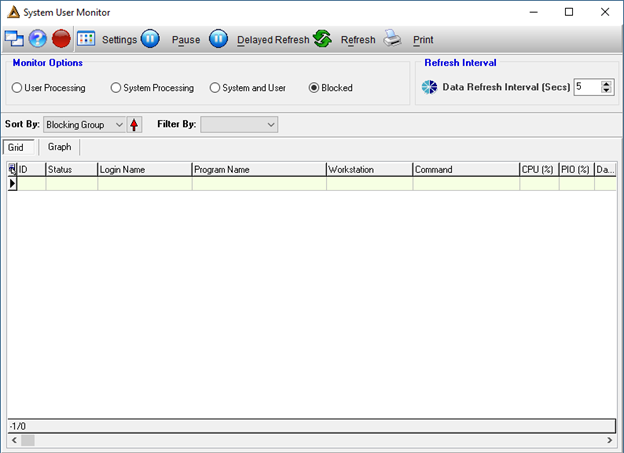
Blocked
The SQL Server database transactions are internally protected by blocking command used in block a database table at the time of update to prevent other applications of changing the data at the same time. This blocking action takes place all the time and is an integral part of the system. Application or workstation problems can however prevent the unblocking of a table causing all other processes that wants to access the table to go into a hang up mode until the table is released again. This function can be used effectively to identify problem processes and application causing unnecessary and too-long blocking of database tables.
Each radio button’s data can be sorted ascending or descending using the ![]()
![]() buttons.
buttons.
Sort by options are:
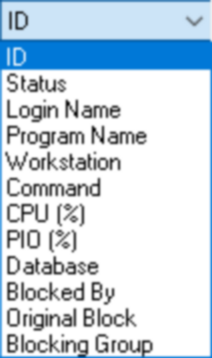
Filter options are:
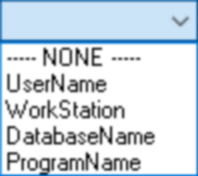
Refresh Interval
This determines how often the data on the screen is refreshed.
The ![]() button will give you the following options:
button will give you the following options:
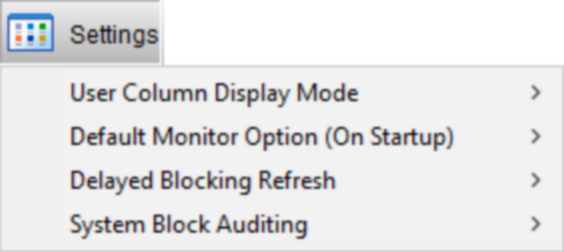
User Column Display Mode

This allows you to change the grid to either display the employee’s name or their login name as per DeltaERP.
Default Monito Option (On Start-up)

This determines which radio button will be the default setting for every time you open the application.
Delayed Blocking Refresh

The refresh interval should be delayed when blocks are found to allow you to investigate. The delay interval can be set to 30 seconds instead of the default 5 seconds.
System Block Auditing

The ![]() button allows you to pause the automatic process refresh timer.
button allows you to pause the automatic process refresh timer.
![]() - Most blocks are over in a flash and while investigating a blocking problem the block might suddenly disappear. This button attempts to solve this problem by giving the user more time to act.
- Most blocks are over in a flash and while investigating a blocking problem the block might suddenly disappear. This button attempts to solve this problem by giving the user more time to act.
The program has two different interval variables. The normal refresh interval and the delayed refresh interval. When you click on the ![]() button, the system will start using the delayed refresh interval which refreshes at a much slower rate than the normal refresh.
button, the system will start using the delayed refresh interval which refreshes at a much slower rate than the normal refresh.
The user can then click the ![]() button and the system will revert back to the faster normal refresh mode. The delayed refresh functionality is only available for the Blocking radio button option.
button and the system will revert back to the faster normal refresh mode. The delayed refresh functionality is only available for the Blocking radio button option.
![]() - This button manually refreshes the process and resource usage information:
- This button manually refreshes the process and resource usage information:
Used if interval timer is very long and the user does not want to wait or if the user has paused the screen and now wants to refresh the data.
The manual refresh button has no effect on the timer. The timer will not reset and will still continue regardless of whether the refresh button was pressed.
![]() - This button will give you the following options:
- This button will give you the following options:

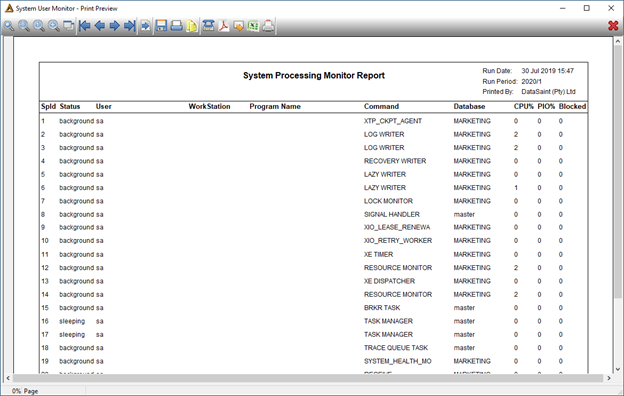
Reports in this application are not company specific due to the nature of the data. It will not include a company logo as per normal DeltaERP standards.
Print Grid
Will print the usage graph if the 'Graph' tab is selected or the process grid in a report if the 'Grid' tab is selected.
Print Audit Data
This option will open a print options screen. All audit report tabs on the options dialog will be made visible based on the menu option chosen.
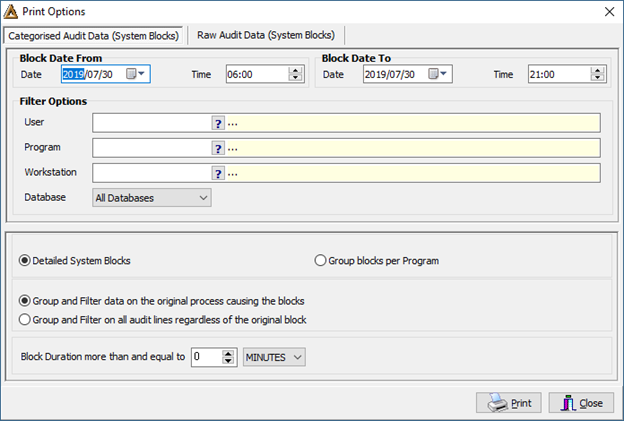
Categorised Audit Data (System Blocks) tab
This report is created from block audit data harvested from within the system user monitor. This data is organised and categorised with many filter options.
Raw Audit Data (System Blocks) tab
This report is created from block audit data harvested from outside the system user monitor. It contains a huge amount of difficult to interpret data. We just print data generically for reference.